
 Xrf Gold Analyzer
 Handheld Alloy Analyzer
 Handheld Mining Analyzer
 Other XRF Analyzer
The landscape of precious metal valuation has undergone a radical transformation over the last three decades, moving from destructive chemical assays to the precision of high-energy photonics. At the heart of this revolution is X-Ray Fluorescence (XRF) technology, a non-destructive analytical method that allows for the instantaneous determination of elemental composition. For refineries, pawnshops, and bullion dealers, the accuracy of an XRF analyzer is directly proportional to the integrity of their profit margins. However, an XRF device is not a static tool; it is a sophisticated optoelectronic system that requires rigorous maintenance and precise calibration to combat the entropy of hardware degradation and environmental drift. This guide serves as a deep-dive into the technical architecture, physics, and procedural protocols necessary to maintain peak performance in industrial gold analyzers.
In the high-stakes environment of gold refining and trading, a deviation of even 0.1% in measurement can lead to thousands of dollars in valuation errors. As global gold prices continue to reach historic highs, the pressure on XRF technology to deliver laboratory-grade precision in field environments has never been greater. This compendium is designed for the technical lead, the laboratory manager, and the field engineer who requires more than just a superficial understanding of “point-and-shoot” testing. We will explore the granular details of sub-atomic excitation, the electrical engineering of high-voltage stability, and the advanced algorithmic corrections that separate industrial-grade instrumentation from entry-level consumer devices.
The Historical Evolution of Fluorescence Technology
To understand the maintenance requirements of modern XRF devices, one must appreciate the century of innovation that led to the current generation of Silicon Drift Detectors (SDD). The journey began in 1895 with Wilhelm Conrad Röntgen’s discovery of X-rays, but it was not until the early 20th century that the analytical potential of these rays was realized. Charles Glover Barkla’s discovery of characteristic X-rays in 1906 provided the first hint that elements emitted unique radiation when excited.
The theoretical foundation was solidified by Henry Moseley in 1913. Moseley’s Law established a systematic mathematical relationship between the frequency of the emitted X-ray and the atomic number of the element. This was a watershed moment, proving that elemental identification could be achieved through spectroscopic analysis. Early XRF systems were massive, laboratory-bound machines that relied on Wavelength Dispersive XRF (WDXRF), using complex crystals to diffract X-rays into individual wavelengths. These systems were mechanically intensive, requiring constant realignment of the goniometer and maintenance of high-vacuum systems that occupied entire rooms.
The shift toward Energy Dispersive XRF (EDXRF), which is the standard for modern gold analyzers, occurred with the development of solid-state detectors in the 1960s and 70s. The introduction of the Si-PIN detector offered a path toward portability, though early versions required liquid nitrogen cooling to reduce thermal noise. This cryogenic requirement limited the practical application of XRF to specialized facilities. By the early 2000s, the advent of Peltier-cooled detectors eliminated the need for cryogenics, allowing for the sleek, desktop, and handheld units we see today. These thermoelectric coolers utilize the Peltier effect to create a heat flux between the junction of two different types of materials, maintaining the detector at sub-zero temperatures even in tropical environments. As the industry looks forward, the gold analyzer industry innovation roadmap for the next decade points toward even higher resolution and faster processing speeds, making maintenance more critical than ever as tolerances tighten. We are now entering an era where “Real-Time Spectral Deconvolution” and “AI-Driven Matrix Correction” are becoming the new standard for precision.
The Atomic Physics of X-Ray Fluorescence
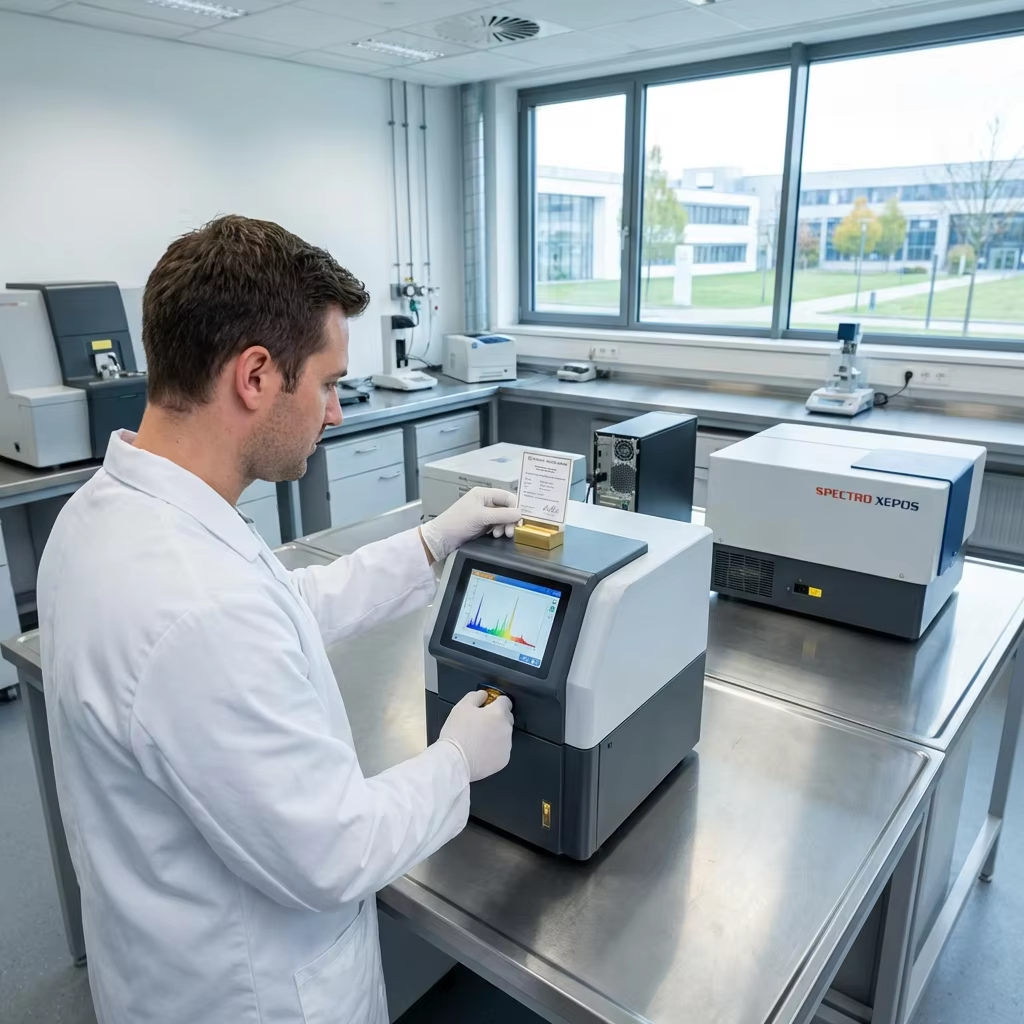
At its core, XRF is a process of electronic displacement and stabilization. When a gold sample is placed in the analyzer, it is bombarded by primary X-rays generated by a high-voltage tube. These photons possess enough energy to overcome the binding energy of an atom’s inner-shell electrons. This energy threshold is known as the “Absorption Edge,” and it is unique for every orbital of every element.
The Excitation Phase
When a primary X-ray photon strikes an atom in the sample (such as Gold, Au), it can eject an electron from one of the inner orbitals, typically the K or L shell. This process is known as the photoelectric effect. The removal of this electron leaves the atom in an unstable, ionized state. The probability of this occurring is highest when the energy of the primary X-ray is just slightly above the binding energy of the electron. This is why selecting the correct target material for the X-ray tube (such as Tungsten, Rhodium, or Silver) is critical for optimizing the excitation of specific elements.
The Fluorescence Phase
To regain stability, an electron from a higher-energy outer shell (such as the L, M, or N shell) drops down to fill the vacancy in the inner shell. Because the outer shell electron has a higher energy state than the vacancy it is filling, the excess energy must be released. This energy is emitted in the form of a secondary X-ray photon. This emitted photon is the “Fluorescence.” The transition from the L-shell to the K-shell produces K-alpha radiation, while the transition from the M-shell to the K-shell produces K-beta radiation.
The Characteristic Signature
Because the energy difference between electron shells is a fixed value for every element on the periodic table, the emitted X-ray is “characteristic” of that specific element. For instance, the K-alpha line for Gold is distinct from the K-alpha line for Copper or Silver. The detector’s job is to count these photons and measure their energy levels. By plotting the number of photons (intensity) against their energy (KeV), the system generates a spectrum. The peaks in this spectrum tell us what elements are present, while the area under the peaks tells us the concentration. Understanding this atomic interplay is essential for anyone following a technical whitepaper comparing XRF with traditional assay methods, as it highlights the precision of photonic analysis over traditional acid testing. Furthermore, the physics of “Escape Peaks” and “Sum Peaks” must be understood by advanced operators, as these electronic artifacts can sometimes be mistaken for trace impurities if the software is not properly calibrated.
High-Voltage Power Supply (HVPS) Ripple Effect on Spectral Resolution
One of the most overlooked components in XRF maintenance is the High-Voltage Power Supply (HVPS). The HVPS is responsible for accelerating electrons toward the anode of the X-ray tube. For a gold analyzer, this voltage typically ranges from 30kV to 50kV. The stability of this DC voltage is paramount. “HVPS Ripple” refers to the small, residual AC components that remain after the conversion of line power to high-voltage DC. Even a minor ripple of 0.1% can have devastating effects on the precision of the analysis.
The primary effect of HVPS ripple is the modulation of the primary X-ray beam’s energy. When the voltage fluctuates, the “Bremsstrahlung” (braking radiation) background and the intensity of the characteristic lines fluctuate in sync. This results in “Spectral Smearing,” where the peaks in the spectrum become wider and less defined. In technical terms, this increases the Full Width at Half Maximum (FWHM), directly reducing the spectral resolution. For a high-end SDD detector, a resolution of 125eV to 135eV is expected at the Manganese K-alpha line. If the HVPS is suffering from aging capacitors or failing regulation circuits, this resolution can degrade to 150eV or higher, making it impossible to distinguish between closely spaced peaks like Gold (Au) and Zinc (Zn) in white gold alloys.
Furthermore, ripple can induce “Dead Time” instabilities. Most modern detectors have a maximum count rate (OCR – Output Count Rate). If the HVPS ripple causes sudden bursts of X-ray intensity, the detector may become temporarily saturated, leading to a loss of data and a non-linear response. Field engineers should monitor the HVPS stability using a specialized high-voltage probe or by analyzing the stability of the peak positions over a 60-minute “warm-up” period. A drifting peak position is often the first sign of a failing HVPS or a temperature-sensitive voltage divider within the power supply unit.
Comparative Analysis of Different Collimator Sizes (0.5mm to 8mm)
The collimator is the optical aperture that defines the size and shape of the X-ray beam as it exits the tube and strikes the sample. Selecting the correct collimator size is not just a matter of convenience; it is a critical decision that balances spatial resolution, count rate, and statistical precision. Most industrial gold analyzers come equipped with a range of collimators, typically from 0.5mm to 8mm in diameter.
The 0.5mm to 1mm Collimators: Precision for Intricate Jewelry
Small collimators are essential for analyzing small, irregular, or multi-component jewelry items. If you are testing a ring with a tiny gold setting surrounded by base metal, or a fine filigree chain, a large beam would capture signal from both the gold and the surrounding material, leading to a “diluted” and incorrect reading. The 0.5mm collimator allows for “Micro-XRF” analysis, targeting a specific spot with high accuracy. However, the trade-off is a significantly lower count rate. Because the aperture is small, fewer X-rays reach the sample, and fewer fluorescent photons return to the detector. To compensate for this, the operator must increase the “Integration Time” (the duration of the test) to ensure a high enough signal-to-noise ratio. Using a 0.5mm collimator for a 10-second test will result in high “Statistical Error,” whereas a 60-second test may be required to reach the same confidence level as a 5-second test with an 8mm collimator.
The 4mm to 8mm Collimators: Bulk Analysis and Bullion
Large collimators are the preferred choice for bullion bars, large coins, and homogenized scrap. The 8mm beam covers a larger surface area, which helps to “average out” any minor surface impurities or non-homogeneities in the alloy. It provides the highest possible count rate, allowing for ultra-fast “3-second screenings” with very high precision (low RSD). This is ideal for high-volume environments like refineries or large-scale pawnshops. However, the engineer must be aware of “Beam Divergence.” At larger collimator sizes, the X-ray beam is not perfectly cylindrical; it spreads out as it travels from the tube to the sample. If the sample is not placed perfectly flat against the measurement window, this divergence can cause “Geometry Effects,” where the intensity of the signal drops off according to the inverse square law, leading to an underestimation of the gold content.
The general rule of thumb for field engineers is to use the largest collimator that fits entirely within the sample’s surface. Using an 8mm collimator on a 4mm wire will result in “Air Scatter” and signal from the background plate, which will compromise the integrity of the assay.
Hardware Maintenance: SDD vs Si-PIN Detectors
The detector is the most sensitive and expensive component of an XRF analyzer. In the gold testing industry, two primary types are used: the Silicon PIN Diode (Si-PIN) and the Silicon Drift Detector (SDD). While both serve the same fundamental purpose, their maintenance requirements differ due to their architecture. The choice between these two often defines the price point and the target market of the instrument.
Maintenance for Si-PIN Detectors
Si-PIN detectors are the “workhorses” of the industry, offering a cost-effective solution for standard gold testing. They have a larger surface area but higher capacitance, which results in slower processing speeds and lower resolution compared to SDD. The “PIN” stands for P-type, Intrinsic, and N-type layers of the semiconductor. Because the capacitance is proportional to the area, these detectors are inherently limited in how fast they can process photons before the signals begin to overlap (a phenomenon known as “Pulse Pile-Up”).
Maintenance for Si-PIN units focuses heavily on thermal management. These detectors rely on Peltier cooling to stay at roughly -30 degrees Celsius. Ensure that the analyzer’s ventilation ports are never obstructed. Dust buildup on the internal heat sinks can cause the Peltier element to work overtime, leading to “electronic noise” in the spectrum and eventually hardware failure. In humid environments, the thermal cycling of the Peltier can lead to microscopic “solder fatigue” over several years, which is why maintaining a stable ambient temperature is critical for the longevity of Si-PIN systems.
Maintenance for SDD Detectors
SDD technology represents the high-end of XRF analysis. By utilizing a unique electrode structure that “drifts” electrons toward a small central anode, the SDD achieves significantly lower capacitance. This allows for much higher count rates and superior resolution, making it possible to detect trace elements and distinguish between gold and similar-energy transition metals. The SDD can process up to 500,000 counts per second (CPS), whereas a Si-PIN might struggle above 50,000 CPS.
Maintenance for SDD is centered on “Window Integrity.” Most high-end SDD detectors use an ultra-thin Beryllium (Be) or Graphene window to allow low-energy X-rays to pass through. These windows are incredibly fragile—often only a few microns thick—and are sensitive to moisture and physical contact. Never touch the detector window, and ensure the analyzer is kept in a low-humidity environment. If the window becomes clouded with oils from fingerprints or atmospheric dust, it will attenuate the signal, specifically affecting the detection of light elements like Zinc, Nickel, or Aluminum in white gold and industrial alloys. For SDD systems, the use of a “Vacuum Chamber” or “Helium Flush” is common to prevent the air from absorbing these low-energy photons, and these subsystems require their own rigorous maintenance schedule, including O-ring lubrication and gas regulator calibration.
Detailed “Energy Scale Calibration” Procedure for Field Engineers
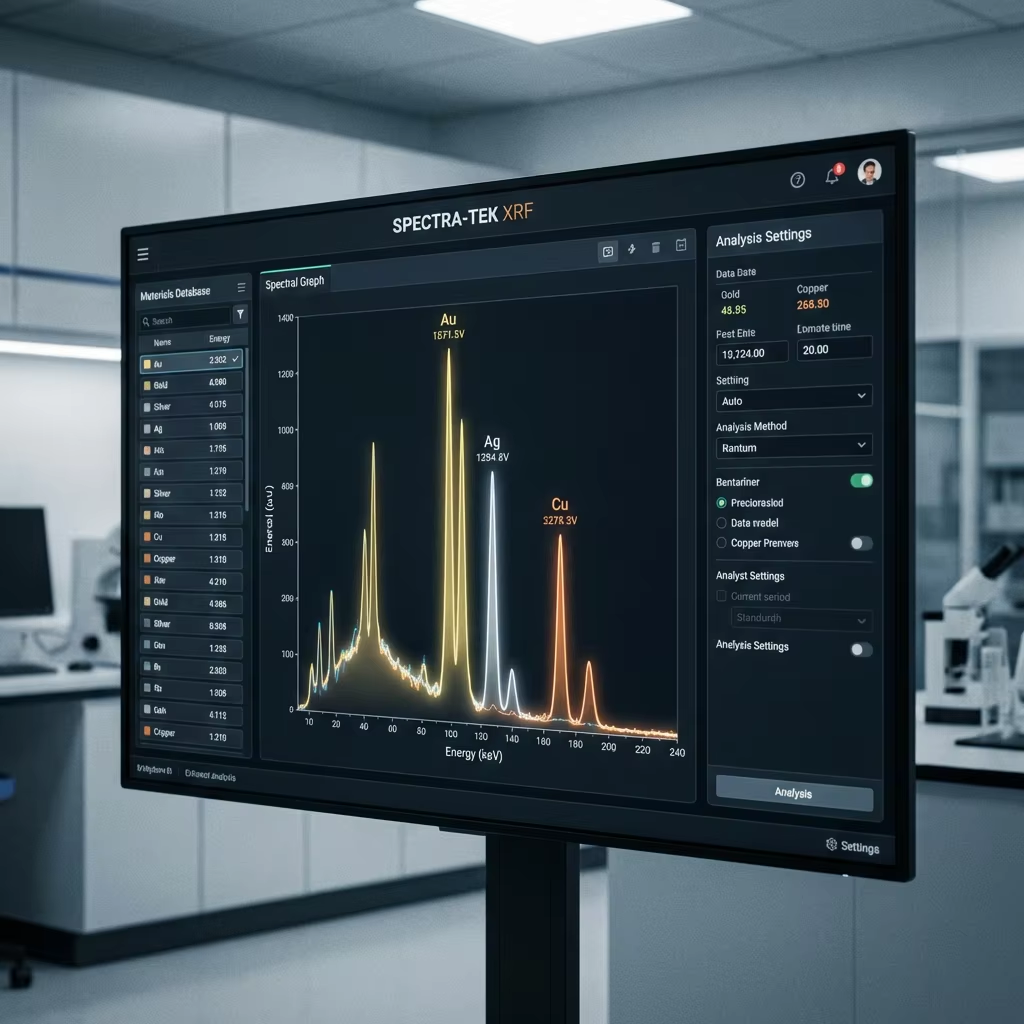
Energy Scale Calibration is the most critical software-hardware alignment procedure. It ensures that the X-axis of the spectrum (Energy in keV) correctly corresponds to the physical reality of the photons being detected. Without a precise energy scale, the software might identify a Gold peak as Platinum, or a Copper peak as Nickel. This procedure should be performed by a field engineer during initial installation, after any major hardware repair, or if the system fails its daily standardization check.
Step 1: The Zero-Offset Adjustment (Baseline Alignment)
The first step is to establish the “Electronic Zero.” This is done by looking at the “Noise Peak” at the very beginning of the spectrum (usually around 0keV). The engineer adjusts the “Zero-Offset” parameter until this noise peak is centered exactly at zero. This accounts for the baseline electronic noise of the pre-amplifier and the Analog-to-Digital Converter (ADC).
Step 2: Gain Adjustment (Slope Calibration)
Once the zero point is fixed, the “Gain” (or Slope) must be calibrated. This requires a reference material with two widely separated and well-defined peaks. Traditionally, a “Copper-Silver” (Cu-Ag) target is used. Copper has a K-alpha peak at 8.04 keV, and Silver has a K-alpha peak at 22.16 keV. The engineer adjusts the “Gain” parameter until the Copper peak is perfectly centered. Because the scale is linear, this should theoretically align the Silver peak as well. If the Silver peak remains slightly off-center while Copper is perfect, it indicates a “Non-Linearity” in the ADC, which may require a multi-point calibration or hardware replacement.
Step 3: FWHM Verification (Resolution Check)
After the peaks are centered, the engineer must measure the Full Width at Half Maximum (FWHM) of the Manganese (Mn) K-alpha peak at 5.89 keV. This is the universal metric for detector health. For a new SDD, the FWHM should be below 140eV. If the FWHM is widening, the engineer must investigate the Peltier cooling efficiency or look for sources of electromagnetic interference (EMI) in the power lines. A widening FWHM is a “Leading Indicator” of impending detector failure.
Step 4: Calibration Validation with CRM
The final step is to run a Certified Reference Material (CRM) of a known gold alloy (e.g., 18K or 22K). The results must be within +/- 0.05% of the certified value. The engineer then locks the calibration parameters to prevent accidental modification by general operators. This multi-point verification ensures that the analyzer is not just “guessing” but is operating within a scientifically traceable framework.
Long-Term Detector Vacuum Integrity Monitoring
Both SDD and Si-PIN detectors are housed in hermetically sealed modules. Inside these modules, the detector chip is mounted on the Peltier cooler. To prevent thermal transfer from the environment and to stop moisture from freezing onto the cooled detector surface, the interior of the module is either evacuated to a high vacuum or filled with an inert, high-purity gas like Neon or Argon. “Vacuum Integrity” is the most significant factor in the 10-year reliability of an XRF analyzer.
The Physics of Outgassing and Permeation
Over time, even the most perfect seals can fail. Molecules from the internal plastics and epoxies can “outgas,” slowly increasing the pressure inside the detector housing. Additionally, atmospheric gases can “permeate” through the microscopic pores of the Beryllium window or the O-ring seals. As the vacuum degrades, the Peltier cooler must work harder to maintain the sub-zero temperature. This increases the “Peltier Current,” which the system software usually monitors. A rising Peltier current over several months is a clear warning sign of vacuum degradation.
Monitoring Dark Current
Another critical diagnostic is “Dark Current”—the small electrical current that flows through the detector even when no X-rays are present. Dark current is highly temperature-dependent. If the vacuum is lost, the detector chip will struggle to stay cold, and the dark current will spike. This results in a massive increase in the “Background Noise” of the spectrum, effectively drowning out the signal from trace elements. In advanced diagnostic software, the “Leak Rate” can be calculated by observing the change in dark current over a fixed time interval.
Preventative Strategies
Field engineers should perform a “Vacuum Health Check” every 12 months. This involves recording the Peltier drive voltage and the FWHM at a fixed ambient temperature. If the system uses a “Getter” (a material that absorbs stray gas), it may need to be “re-activated” or the entire detector module may need to be “re-pumped” in a specialized laboratory. Maintaining vacuum integrity is the difference between a detector that lasts 3 years and one that lasts 15 years.
Software Calibration Algorithms: The Math Behind the Accuracy
Even a perfectly maintained hardware system will produce incorrect results if the software algorithms are not calibrated. Calibration is the process of teaching the software how to convert raw photon counts into percentage concentrations. This is where the physics of the X-ray interaction meets the logic of computer science.
Slope and Intercept Models
The simplest form of calibration is the Linear Regression model, often expressed as y = mx + b. In this equation, “y” is the calculated concentration, “m” is the slope (sensitivity), “x” is the measured intensity, and “b” is the intercept (background). During calibration, known reference standards are tested. If the analyzer reads 17.8% for an 18.0% gold standard, the software adjusts the slope to align the reading with the known value. This is a basic “Drift Correction” that should be performed daily to account for the natural aging of the X-ray tube.
Linear vs Quadratic Regression
While linear models work well for simple alloys, they often fail when dealing with complex matrices found in high-carat jewelry or industrial scrap. Linear Regression assumes that the intensity of gold increases at a constant rate with its concentration. However, “Matrix Effects” can cause non-linear behavior. For example, the presence of large amounts of Copper in a gold alloy can absorb Gold X-rays (Absorption) or actually stimulate further Gold fluorescence (Enhancement). Quadratic Regression (y = ax^2 + bx + c) is used to account for these curves. Modern high-end software utilizes “Fundamental Parameters” (FP), which is a “standardless” calibration method. FP uses complex physics-based equations to calculate the inter-element effects based on the entire spectrum, providing a much higher degree of accuracy for unknown alloys. This level of mathematical rigor is what makes XRF the preferred choice in a comprehensive guide to selecting and operating gold analyzers for pawnshops, where speed and accuracy are non-negotiable.
Advanced “Ratio Analysis” for Identifying Thick Gold Plating
One of the greatest challenges in the gold trade is the “Super-Fake”—items with a thick layer of gold plating (50 to 100 microns) that can deceive standard XRF analyzers. Because XRF is a surface-sensitive technique, the primary X-rays often cannot penetrate deep enough to reach the base metal core. To combat this, advanced analyzers employ “Ratio Analysis,” a technique that exploits the differential energy levels of Gold’s characteristic lines.
The K/L Ratio Principle
Gold emits two primary sets of characteristic X-rays: the L-lines (around 9-11 keV) and the K-lines (around 67-80 keV). The lower-energy L-lines are very easily absorbed by any material they pass through, including the gold itself. The higher-energy K-lines, however, are much more penetrating. In a solid 18K gold item, there is a fixed, predictable ratio between the intensity of the L-alpha peak and the K-alpha peak. If the item is actually a thick gold-plated tungsten bar, the tungsten core will absorb the L-lines and K-lines differently. More importantly, the software looks for the “Ratio Deviation.” If the L-lines are much stronger than they should be relative to the K-lines, it suggests that the gold signal is coming only from a thin surface layer, rather than a solid mass.
The L-alpha / L-beta Differential
Even more subtle is the analysis of the L-series itself. L-alpha (9.7 keV) and L-beta (11.4 keV) photons have slightly different “Mean Free Paths” within the gold lattice. By calculating the ratio of L-alpha to L-beta, the software can estimate the “Effective Depth” of the gold. If this depth is inconsistent with a solid alloy, the analyzer triggers a “Plating Alert.” This stochastic modeling allows the device to “see” beneath the surface without actually penetrating the metal. This is a critical feature for any operation following the latest ROI report on global gold market opportunities, as it prevents the catastrophic loss associated with purchasing high-value fakes.
Traceability and Global Standards
In the global gold trade, a measurement is only as good as its traceability. This means the result can be traced back to an internationally recognized standard through an unbroken chain of comparisons. Without traceability, an XRF reading is merely an opinion, not a scientific fact.
ISO 17025 Accreditation
For professional labs and refineries, adhering to ISO 17025 is mandatory. This standard specifies the general requirements for the competence to carry out tests and calibrations. An ISO 17025 compliant maintenance schedule involves documented monthly performance checks using certified reference materials (CRMs). It also requires regular “Proficiency Testing,” where the lab’s results are compared against those of other accredited labs to ensure there is no “Systemic Bias” in their methodology. This level of oversight ensures that a gram of gold measured in London is the same as a gram of gold measured in Hong Kong.
NIST and CRM Standards
Calibration should always be performed using standards from organizations like the National Institute of Standards and Technology (NIST) or the BAM (Federal Institute for Materials Research and Testing). These standards come with certificates stating the exact elemental composition and the uncertainty level (e.g., 99.95% +/- 0.02%). Using “coin gold” or “shop scrap” as a calibration standard is a critical error, as the impurities in these samples are unknown and will bias the analyzer. Maintaining these standards is part of the stringent compliance and regulatory standards for gold testing that govern the industry. Standards should be stored in a desiccator to prevent surface oxidation, as even a thin layer of oxide can alter the XRF signal for light elements.

Strategic Operations: Preventive Maintenance Protocols
To maximize the lifespan of your equipment and ensure the highest possible ROI, a proactive maintenance schedule is required. This is particularly relevant given the volatile nature of the precious metals market, where equipment downtime could result in significant lost revenue as gold prices fluctuate. A well-maintained analyzer is not just a tool; it is a reliable financial safeguard.
Daily Operational Checks (The “Golden Rule”)
Every morning, the operator must perform a “Standardization” or “System Check.” This usually involves testing a built-in Silver or 316 Stainless Steel plate. This check verifies three things: first, that the X-ray tube is hitting the correct voltage; second, that the detector’s energy resolution is within limits; and third, that the “Dead Time” is consistent with previous days. If the standardization fails, the analyzer should be locked until an engineer can verify the energy scale. This prevents the “Normalization of Deviance,” where small errors are ignored until they become major financial liabilities.
Monthly Environmental Maintenance
Inspect the sample chamber for debris. Tiny filings of gold or silver can accumulate over time, often falling into the gaps around the measurement window. If these filings are caught in the X-ray beam path during a test, they will cause “Ghost Peaks,” leading to an overestimation of gold content. Use compressed air or a soft, lint-free cloth to clean the chamber. Additionally, check the cooling fans and filters. XRF analyzers generate a significant amount of heat (the X-ray tube is only about 1% efficient; the other 99% of energy is converted to heat). If the cooling system is compromised, the internal temperature will rise, causing the electronics to drift.
Annual Professional Certification
Once a year, the analyzer should be serviced by a certified technician. This service includes a radiation leak test (using a Geiger counter) to ensure the shielding remains intact, and a deep-cleaning of the internal optical path. The technician will also perform a “Full Calibration Reset,” where the original factory settings are compared against the current performance to identify any long-term hardware degradation. This annual “Physical” for your analyzer ensures that it remains compliant with local radiation safety regulations and international assay standards.
The Comprehensive XRF FAQ: Technical Inquiry
How does temperature affect my analyzer’s accuracy?
High-precision electronics are sensitive to thermal expansion. If the ambient temperature changes by more than 10 degrees Celsius, the detector’s gain can shift. Most modern analyzers have internal temperature sensors that apply a correction factor, but it is best practice to re-calibrate the “Energy Scale” if the room temperature fluctuates significantly. Extreme heat can also reduce the life of the Peltier cooler, so maintaining a climate-controlled environment (20-25°C) is ideal for long-term stability.
Why does my analyzer show 99.9% gold on a 99.5% bar?
This is often a “Saturation” or “Dead Time” issue. If the X-ray tube intensity is set too high for a pure sample, the detector is overwhelmed by photons and cannot process them fast enough. This leads to a loss of data, particularly for the trace elements that should be subtracting from the gold total. Lowering the tube current or using a smaller collimator (e.g., moving from 8mm to 2mm) can resolve this by reducing the total photon flux reaching the detector.
Can XRF detect gold plating?
Standard XRF is a surface analysis tool, typically penetrating only 10 to 50 microns. While it can identify the presence of gold, it might not “see through” thick plating to the base metal. Advanced units use “Ratio Analysis” or “Multi-Layer Calibration” to detect discrepancies between the K and L lines of gold, which can flag potential plating. However, for 100% certainty on very thick plating, XRF should be used in conjunction with ultrasonic thickness testing or conductivity measurements.
What is the lifespan of an X-ray tube?
In a well-maintained system, an X-ray tube should last between 5 and 10 years (or roughly 10,000 to 20,000 hours of operation). The primary factor in tube failure is “Arcing” caused by running the tube at maximum voltage in a humid or dusty environment. Another factor is “Filament Evaporation,” where the Tungsten filament slowly thins over time until it breaks, much like a traditional light bulb.
How do I know if my detector is failing?
The most common sign of detector failure is a widening of the spectral peaks (increased FWHM). If a peak that should be narrow and sharp begins to look like a broad hill, the detector is losing its resolution and requires replacement. Other signs include a sudden increase in the “Background Noise” or the appearance of random “Spike Peaks” that do not correspond to any known element.
What is the difference between EDXRF and WDXRF?
EDXRF (Energy Dispersive) measures the energy of the photons directly using a solid-state detector. WDXRF (Wavelength Dispersive) uses a crystal to separate X-rays by their wavelengths before detection. WDXRF is significantly more accurate for trace elements (ppm levels) and has better resolution, but it is far more expensive, much slower, and requires a bulky, non-portable setup. EDXRF is the industry standard for the gold trade due to its speed and portability.
Does the sample shape affect the reading?
Yes. XRF assumes a flat, infinite sample surface. Irregularly shaped jewelry can cause “Geometry Effects” where X-rays are scattered away from the detector or the path length of the X-rays is altered. Always try to place the flattest part of the sample over the measurement window. For very irregular items, taking multiple readings at different orientations and averaging the results is a common strategy to mitigate geometry errors.
Can XRF identify the “origin” of the gold?
By analyzing the specific “trace element fingerprint” (the tiny amounts of Tin, Lead, Antimony, or Indium), specialized software can sometimes correlate a sample with a specific mining region or refinery. However, this requires an extensive and up-to-date reference database. Because gold is so frequently recycled and mixed, “Origin Analysis” is often more successful for raw nuggets than for finished jewelry.
Why is Silver calibration so important for gold testing?
Silver is the most common alloying element in gold. Because the Energy peaks of Silver (22.1 keV) and Cadmium (23.1 keV)—a regulated toxic element—are relatively close, a precise Silver calibration is necessary to ensure the software doesn’t misidentify these elements. Furthermore, silver intensity is often used as an internal standard to correct for matrix effects in lower-carat gold alloys.
Is the radiation from an XRF analyzer dangerous?
Modern analyzers are “Closed Beam” systems or have infrared proximity sensors that shut off the X-ray tube if no sample is detected. As long as the safety interlocks are not bypassed and the shielding is intact, the radiation exposure to the operator is negligible—typically lower than the natural background radiation received during a single cross-country flight. However, operators must always follow “ALARA” (As Low As Reasonably Achievable) principles and never point a handheld unit at themselves or others.
What is “Matrix Effect” in simple terms?
It is the way elements in a sample interfere with each other. Imagine trying to hear a single person (Gold) in a crowded room (Copper/Zinc). The noise of the others makes it harder to hear the one person. Additionally, some people in the room might be repeating what the first person says (Enhancement) or shouting over them (Absorption). Calibration algorithms like Fundamental Parameters (FP) act as a “Smart Filter” to sort through this interference.
What is the role of the “Pre-Filter” in XRF?
A pre-filter is a thin piece of metal (like Aluminum or Nickel) placed between the X-ray tube and the sample. Its job is to “shape” the primary beam by absorbing unwanted low-energy X-rays that only contribute to background noise. By using different filters, the engineer can optimize the analyzer for different tasks—one filter for high-purity gold, another for complex silver alloys.
How does “Sum Peak” artifacts occur?
A “Sum Peak” occurs when two photons hit the detector at almost exactly the same microsecond. The detector cannot distinguish them as separate events and instead records a single photon with the combined energy of both. For example, two Iron (Fe) photons at 6.4 keV can create a sum peak at 12.8 keV. If the software is not aware of this, it might misidentify the sum peak as another element like Selenium. Maintaining a reasonable count rate is the best way to prevent sum peaks.
Can XRF analyze liquids or powders?
Yes, but they require special handling. Liquids must be placed in a “Sample Cup” with a thin Mylar or Prolene window. Powders should be pressed into a “Pellet” or placed in a similar cup. The key challenge with liquids and powders is “Homogeneity”—if the sample is not well-mixed, the XRF reading will only represent the top few microns, which may not be representative of the whole.
Why is the “Balance” or “Remainder” important in the results?
In XRF analysis, the sum of all elements should theoretically equal 100%. If the analyzer detects 75% Gold and 20% Copper, the 5% “Balance” indicates elements that the analyzer cannot see (like plastics, lacquers, or very light elements like Beryllium). A high balance is often a sign of a “Dirty Sample” or the presence of non-metallic coatings that need to be removed before a final assay.
Final Technical Summary
Maintaining an XRF gold analyzer is a discipline of consistency. By understanding the atomic physics of fluorescence and the mechanical sensitivities of SDD and Si-PIN detectors, operators can move beyond “push-button” testing into the realm of professional metrology. Calibration is not a one-time setup but a continuous dialogue between the hardware and the software, mediated by high-quality reference standards and rigorous procedural checks. As the precious metals market becomes increasingly sophisticated and the prevalence of advanced counterfeits grows, the ability to provide traceable, accurate, and repeatable results will be the defining characteristic of successful operations. Through rigorous preventive maintenance, detailed energy scale calibration, and a deep understanding of the underlying technology—from HVPS stability to ratio analysis—the XRF analyzer remains the most powerful and reliable tool in the modern assayer’s arsenal. Investing in technical knowledge is as important as investing in the hardware itself, ensuring that your facility remains at the forefront of accuracy in the global gold economy.
Related Resources
Continue your research with these in-depth WiserMachine guides: