
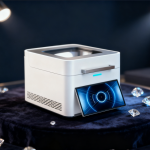
 Xrf Gold Analyzer
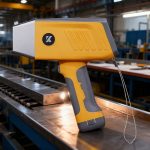 Handheld Alloy Analyzer
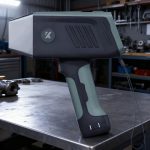 Handheld Mining Analyzer
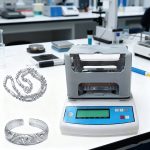 Other XRF Analyzer
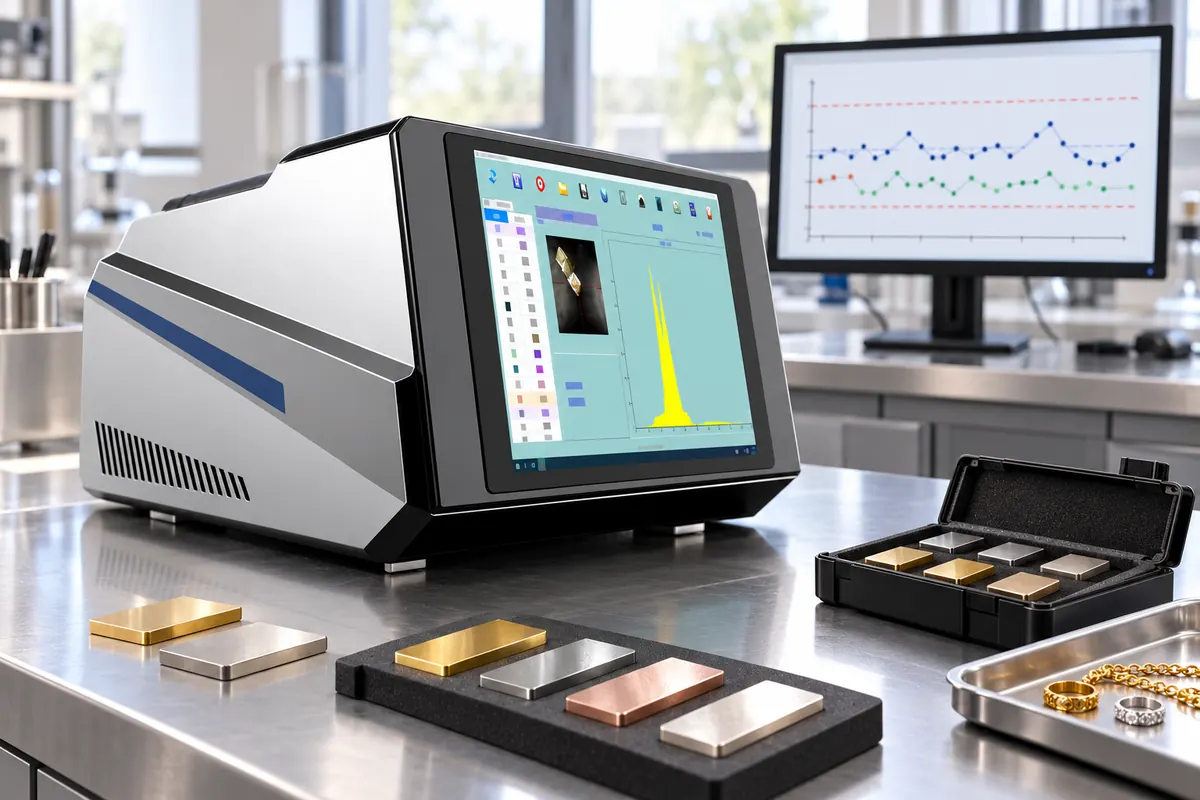
XRF calibration drift is a sustained change in response over time, not one unusual reading. Monitor it with a stable reference or control sample tested under fixed conditions, chart one or more relevant element results, and investigate warning or action signals against a documented baseline. Limits should come from validated method performance and business risk; there is no universal percentage that fits every analyzer, matrix or concentration.
Quick answer
| Decision | xrf calibration drift control chart |
| First check | Confirm sample construction, geometry, target elements and the exact business decision. |
| Before quotation | Send clear sample photos with dimensions, daily volume, destination, voltage and reporting needs. |
Build a stable monitoring system
- Choose a durable homogeneous monitor sample near the alloy family and concentrations that matter to routine decisions.
- Fix the method, measurement time, position, preparation and environmental conditions used for every check.
- Establish the baseline only after the analyzer and method are stable and enough observations represent normal variation.
- Chart relevant elemental values or response indicators rather than only the displayed grade label.
Separate drift from random variation
- Repeat an unexpected check before declaring drift and inspect positioning, contamination and sample condition.
- A one-session spread is a repeatability issue; a directional shift across days suggests drift or a systematic change.
- Changes after service, software updates, transport or method edits should start a documented review.
- Use a second independent reference when possible to separate monitor-sample damage from instrument behavior.
Define warning and action rules
- Set warning and action limits from validated historical performance, reference uncertainty and the risk of a wrong business decision.
- Investigate trends, repeated same-side results or step changes even when one point remains inside a limit.
- Stop release decisions when the action rule is triggered until the cause is resolved and acceptable performance is demonstrated.
- Record corrective action, verification results and the date routine testing resumed.
Practical decision table
| Sample or condition | Action | Reason |
|---|---|---|
| One isolated point | Repeat and inspect setup | May be random or positioning error |
| Gradual same-direction trend | Investigate drift | Systematic change possible |
| Step change after service | Reverify baseline | Configuration may have changed |
| Action limit exceeded | Stop and resolve | Protect release decisions |
Evidence and method boundary
Use the model manual, an approved method and suitable reference materials before making purchase, release or compliance decisions. Technical references include the Malvern Panalytical Theory of XRF, Bruker XRF sample preparation and drift-monitor guidance. These sources explain the method boundary; they do not replace model-specific configuration, laboratory confirmation or local legal advice.
Recommended WiserMachine path
Review WM9800 and compare WM7700. The exact detector, collimator, calibration, software and reporting configuration must be confirmed against real samples before ordering. You can also browse the complete XRF product catalog.
Related guides
Continue with daily XRF repeatability checks, reference-standard verification, or use the support center for preparation, operation and service guidance.
Build an XRF drift-monitoring procedure
Send sample photos, dimensions, target elements, expected range, daily volume, reporting needs, voltage and destination. WiserMachine will confirm a suitable configuration and freight plan before quotation.
Frequently Asked Questions
Is calibration drift the same as poor repeatability?
No. Repeatability describes short-term spread; drift is a sustained response change over time.
What limits should be used on the control chart?
Use limits derived from validated normal performance, reference uncertainty and the required decision risk, not a universal percentage.
Does a failed monitor check always require recalibration?
Not automatically. First investigate sample condition, positioning, contamination, settings and recent changes, then follow the approved corrective-action procedure.